My first time using the health inspections data I created a exploratory dashboard people could use to easily navigate and search violations of specific restaurants. Re visiting the info I was able to pull more information such as the times, duration, purpose and city/state using BeautifulSoup4. I also used the yelp api which had information on roughly ~2000 of the facilities to classify them by price/rating/cuisine.
This time I focused on 3 main topics Violations, Inspections and Chains. Violations focuses on which are the most common, different types of violations and how many places received no violations. Inspections the goal is to find out when inspections occur, how often inspections are and how long they last. Lastly, Chains focuses on popular restaurants and how they stack up against each other and finally I used yelpAPI to categorize places and some python experimentation to find restaurants that keep getting the same violations.
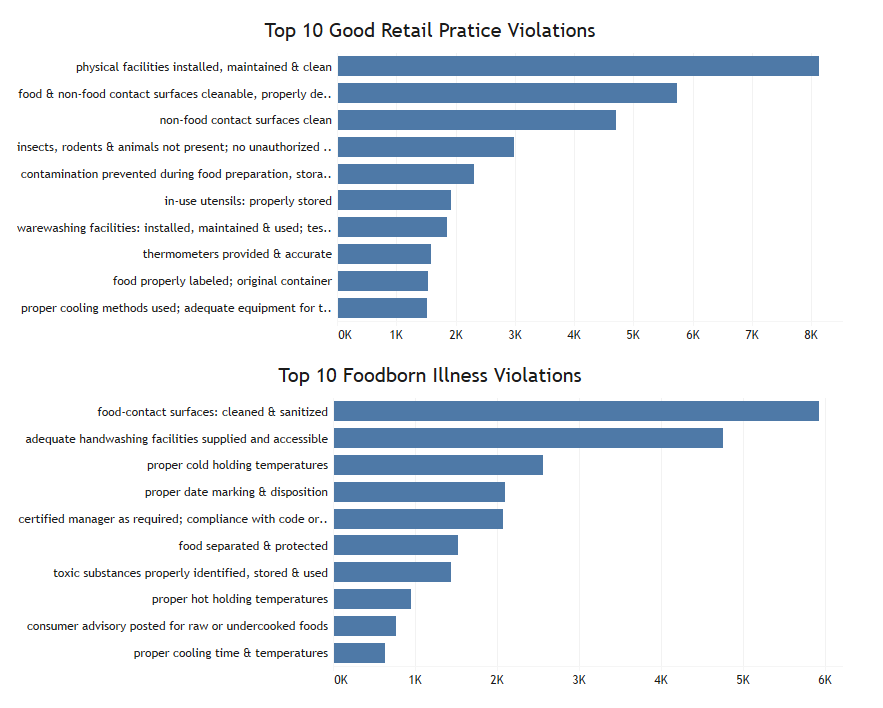
Starting off violations are separated into 2 categories "good retail practice" and "foodborne illness". Foodborne illness focuses around handling of food and proper temps while retail practices can be anything from a clean bathroom to no paper towels. Here you can see the top 10 Violations for each category.
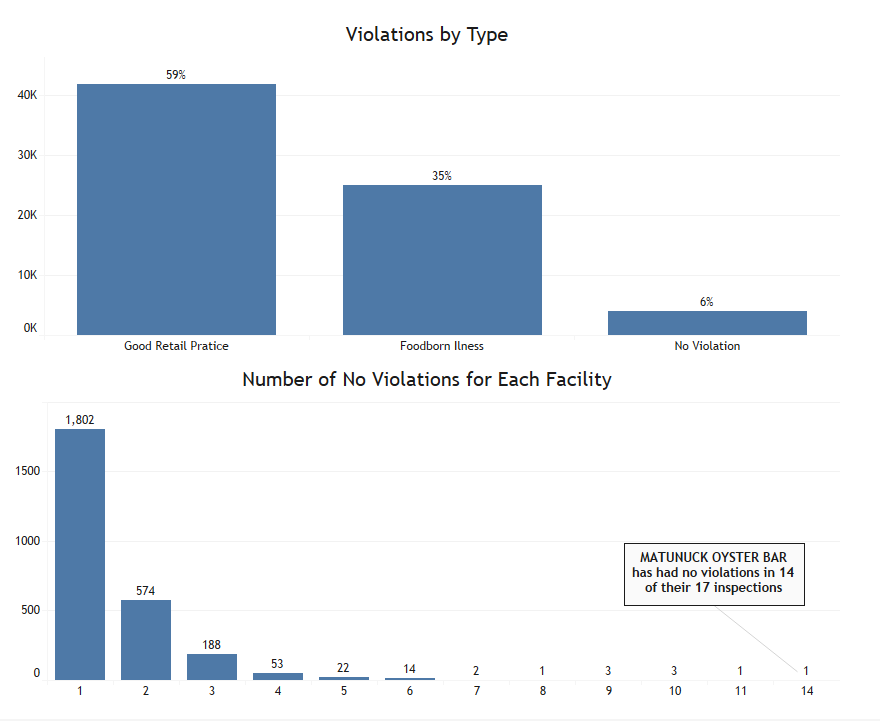
Moving on you can see that 59% of violations are "Good retail practice" and 35% from "foodborne illness" violations. Interestingly when you look at the top 9 facilities for having no violations all are Mobile Food / Catering Licenses. These inspections are different from typical restaurants and appear to be much more frequent.
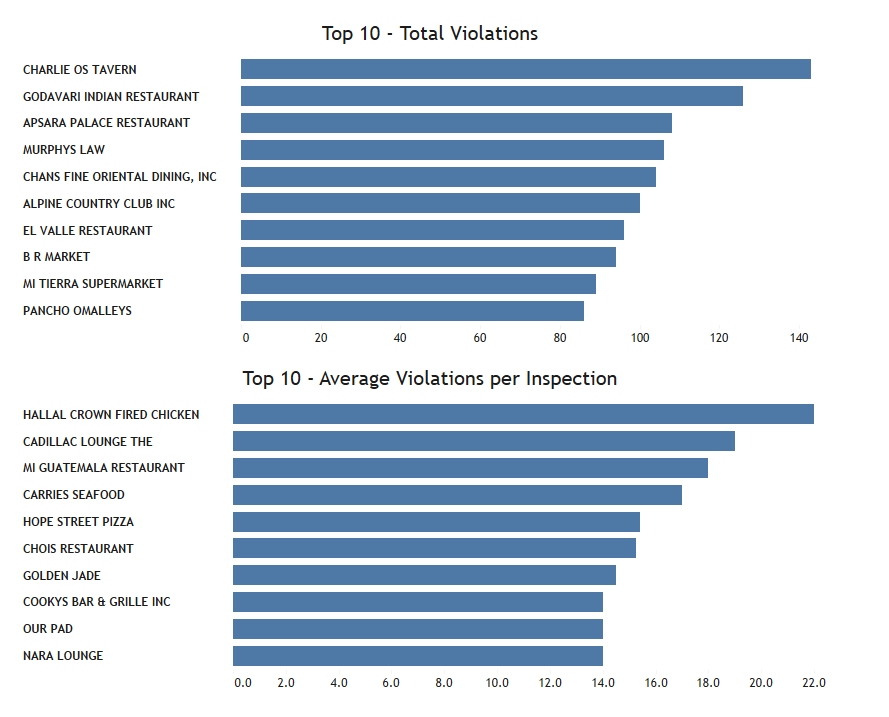
Charlie O's Tavern tops the total violations chart with 143 violations in their 12 inspections. In the 2nd graph the most notable is probably Hope Street Pizza, which has an average of 15 violations per inspection across 5 inspections.
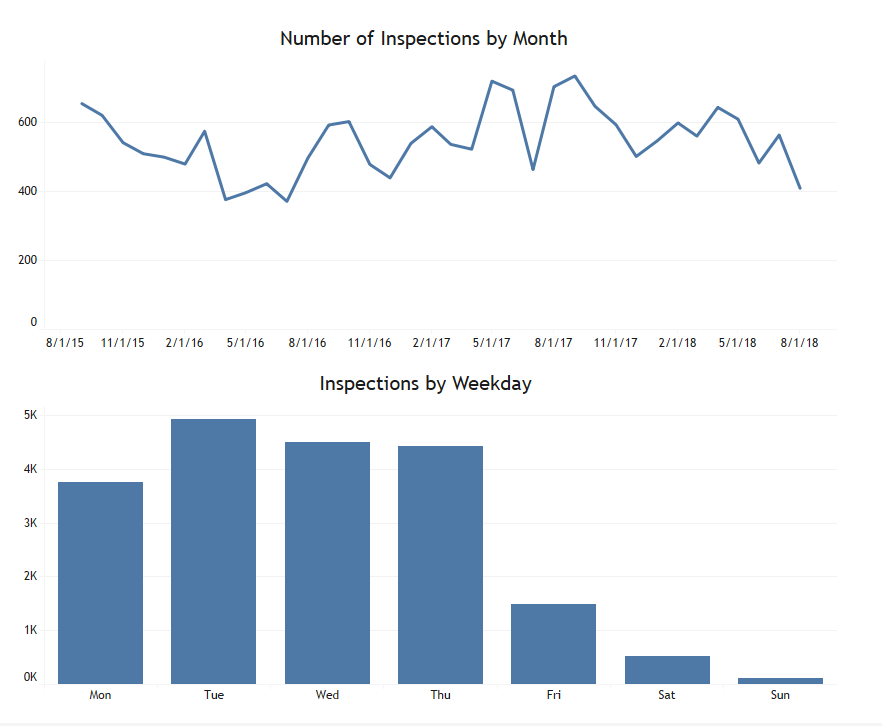
This was interesting when looking at day of the week Monday & Friday are both noticeably down during the week and of course very few inspections on the weekend. Because inspections are un announced and random, these are probably mostly places only open on the weekend or events.
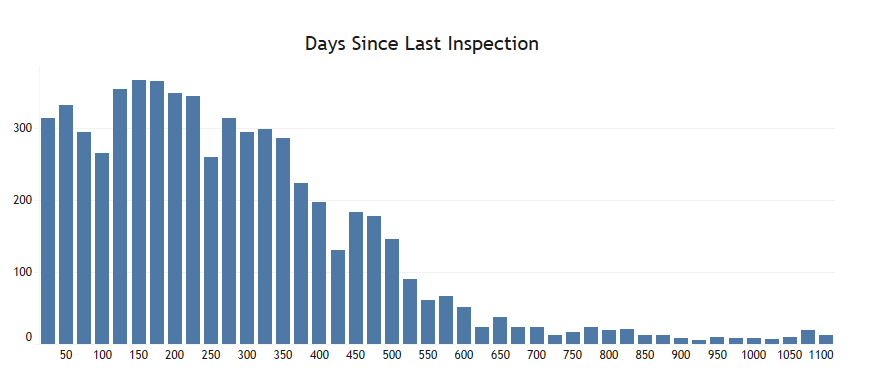
roughly 75% of facilities were inspected within the last year though some have gone even a whopping 1,000 days with no inspection.
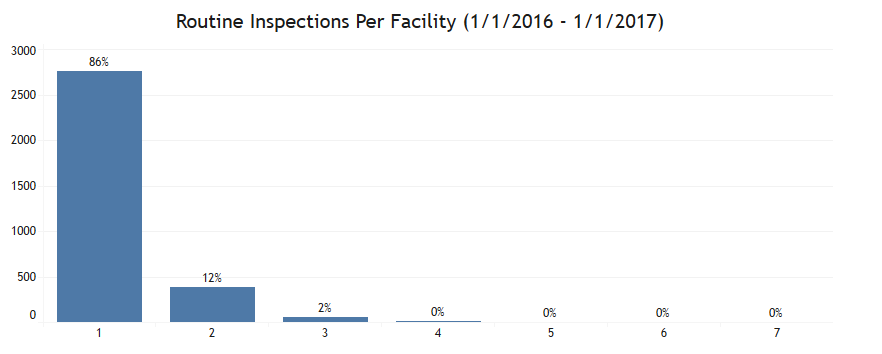
I decided to look specifically at 1 year's worth of data which shows 86% of facilities inspected are inspected once during the year. Schools makeup ~60% that have had 2 routine inspections a year.
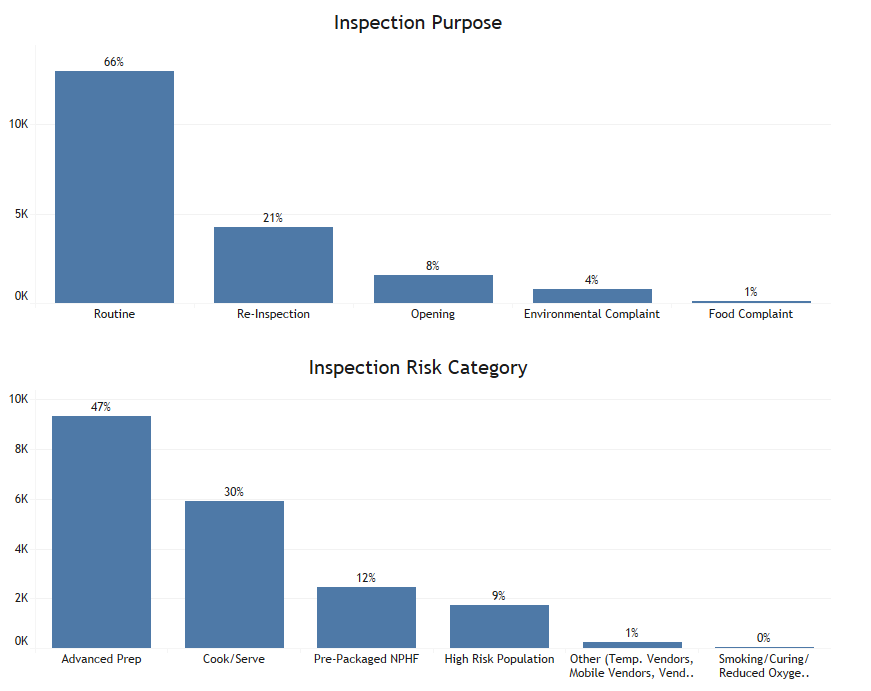
66% of inspections are routine inspections with only 5% coming from complaints. With most Risk Categories being advanced prep and Cook / Serve.
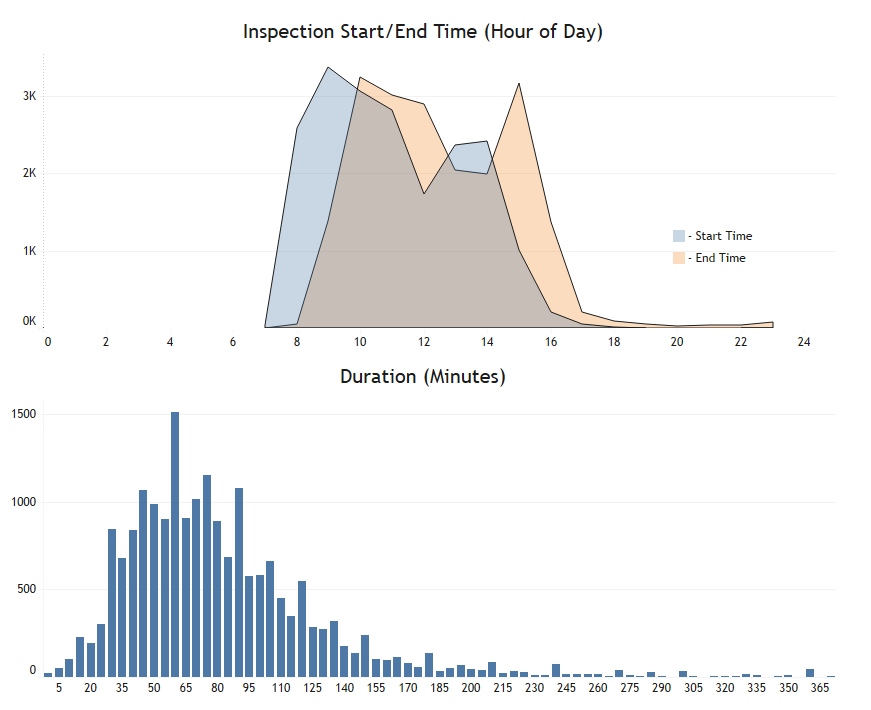
I was able to pull time in/out using python here you can see most inspections start between 9-11 am and end 10am-12pm with a big spike ending at 3pm as well, I suppose even health inspectors need a lunch break. Most inspections last around an hour with 85% under 2 hours. There were a few errors of 0 duration and any times that rolled into the early AM ex) 1am 2am 3am, resulted in large differenced that I excluded.
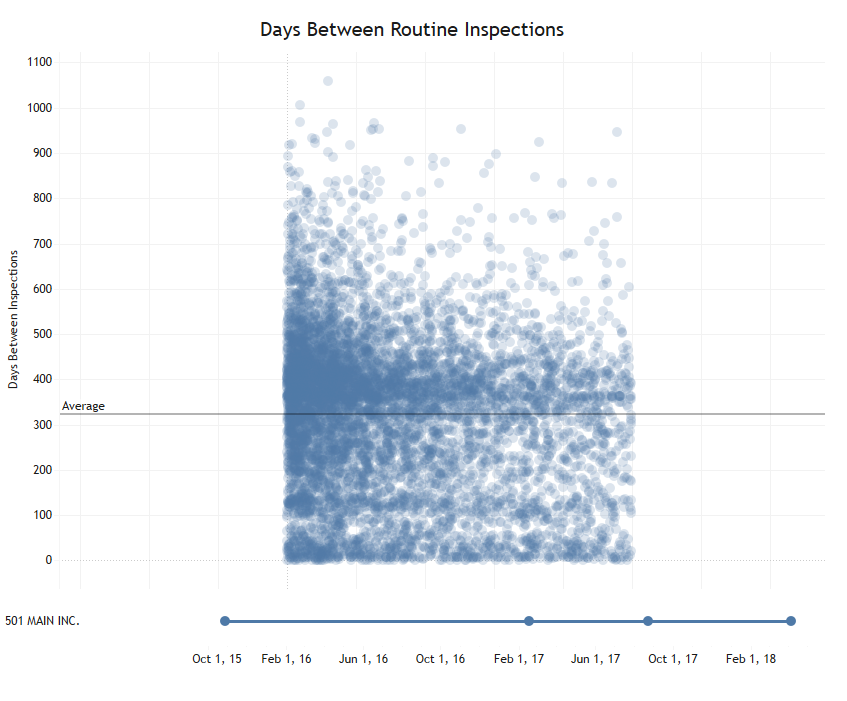
This takes every routine inspection and measures how many days between them for each unique facility. The average day between routine inspections is 323 days and the longest was for "Local Hero INC" at 1,059 days.
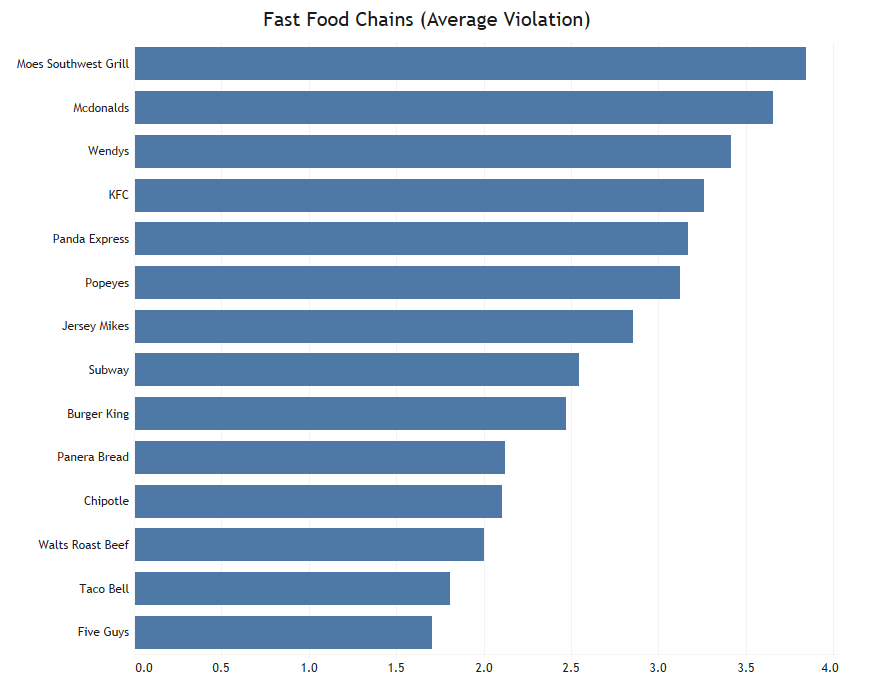
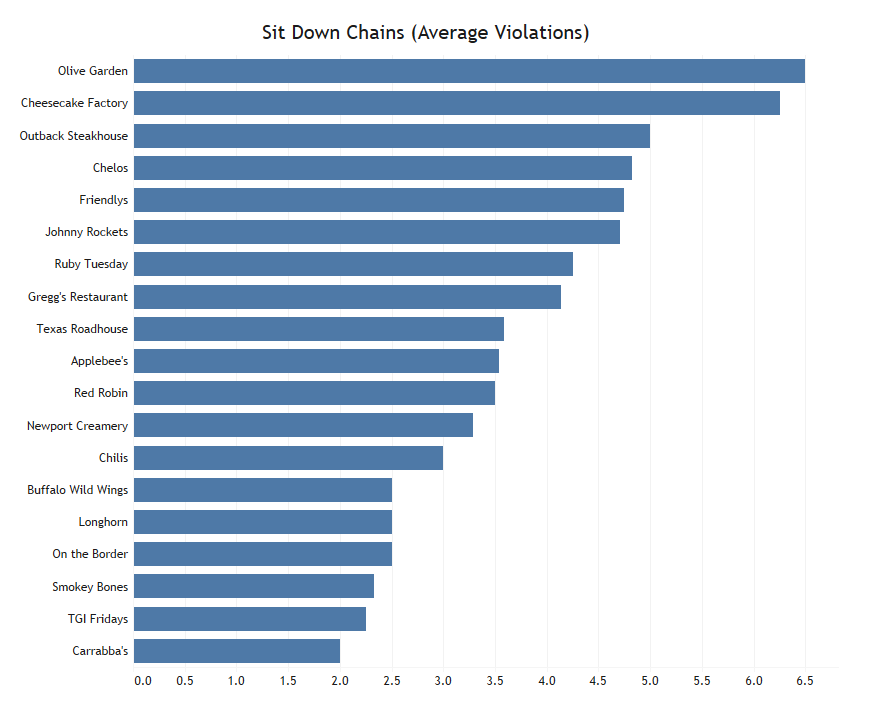
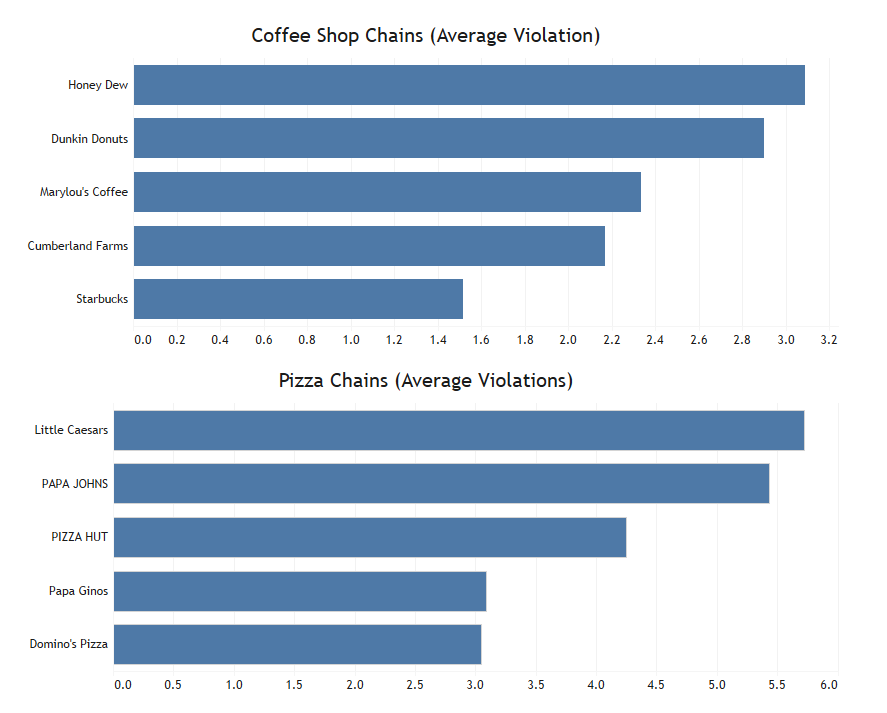
Dealing with chains was a bit challenging, as some would name their stores "McDonalds no. 3431" etc. Luckily dealing with this in tableau is fairly simple, just tedious using tableaus grouping feature to join them all together. Keeping in mind the average violation for all inspections is about 3.6 this would mean only Moes is above the average very slightly. Overall most chains are under the average number of violations.
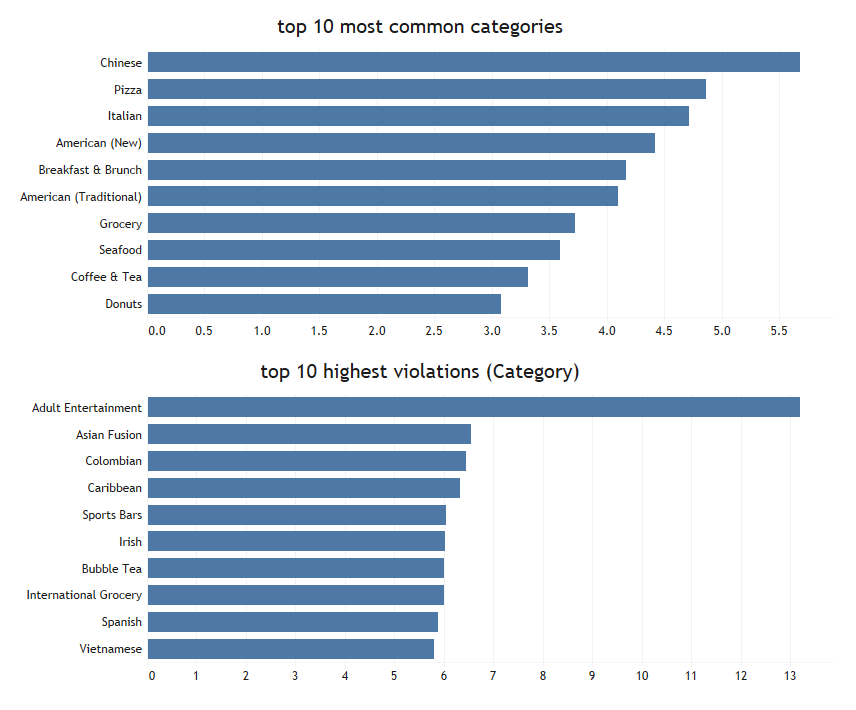
These are the categories that yelp returned for the location. The top is the most common categories and the bottom are the categories with more then 2 resturuants that have the highest violations average. The yelpapi returned a lot of niche categories of cuisine that only fit 1 restaurant.
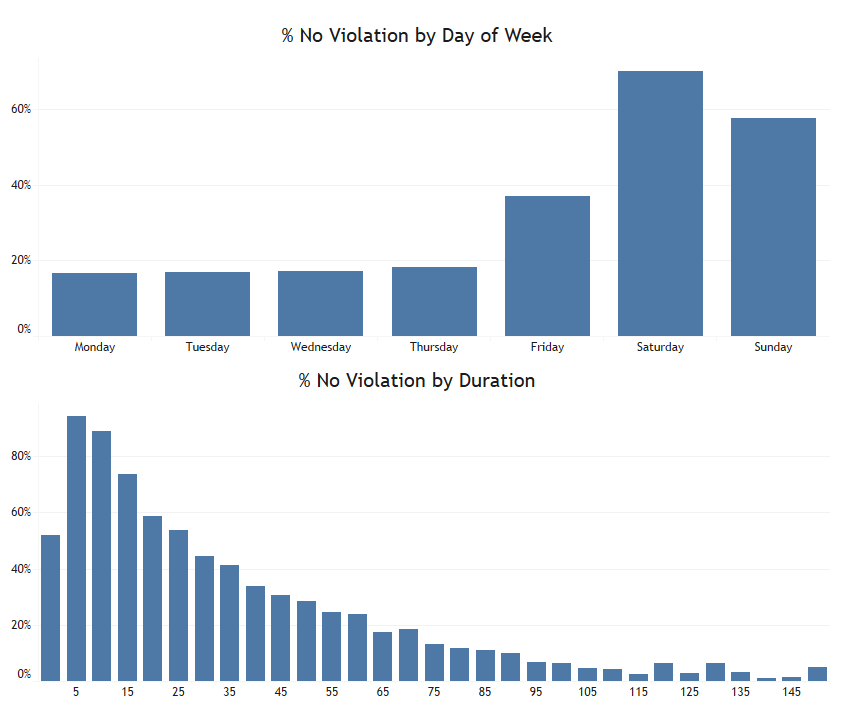
I decided to look into when inspections resulting in no violation occurred and saw that though Saturday makes up a very small number of inspections. 70% of them ended up with no violation and 58% on Sunday.
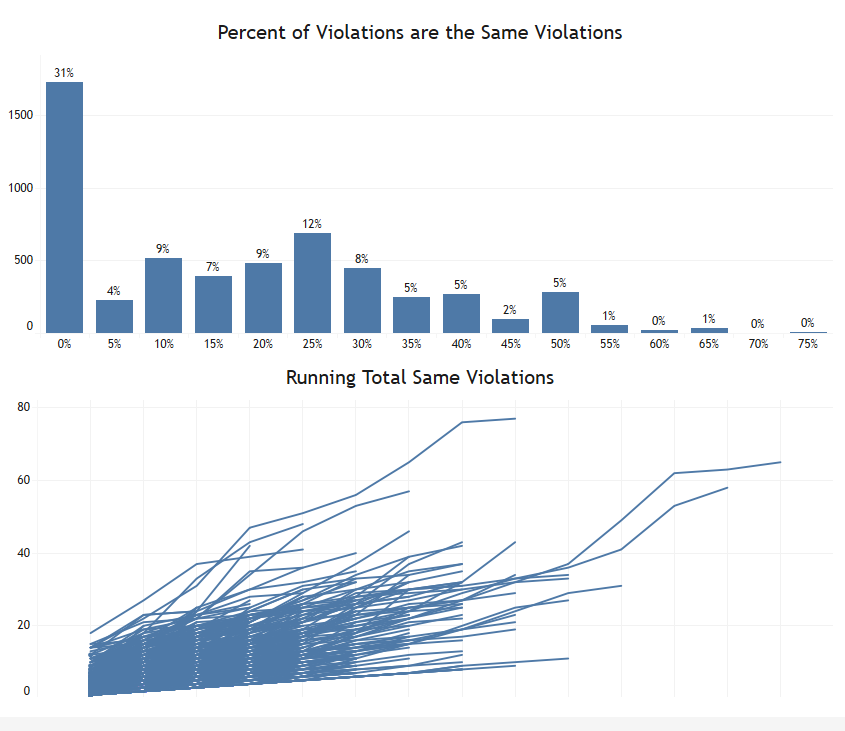
Lastly, I wanted to see how often restaurants were getting the same violation in a row. The way this works is, if a facility had the same violation 2 inspections in a row it will increase by 1. For example, the line at the top "Charlie O's Tavern" had violation 53 (physical facilities installed, maintained & clean) in 11 out of 12 inspections.