Previously, my use of election data was limited to viewing turnout and showing votes for each candidate showing which recieved more votes. This year I used Python & Pandas to find some interesting facts hidden within the primary election data. Things like, which endorsed candidate lost their election, or if mail-in votes effect the outcome from the ballot box on election day.
Endorsed Candidates Who Lost
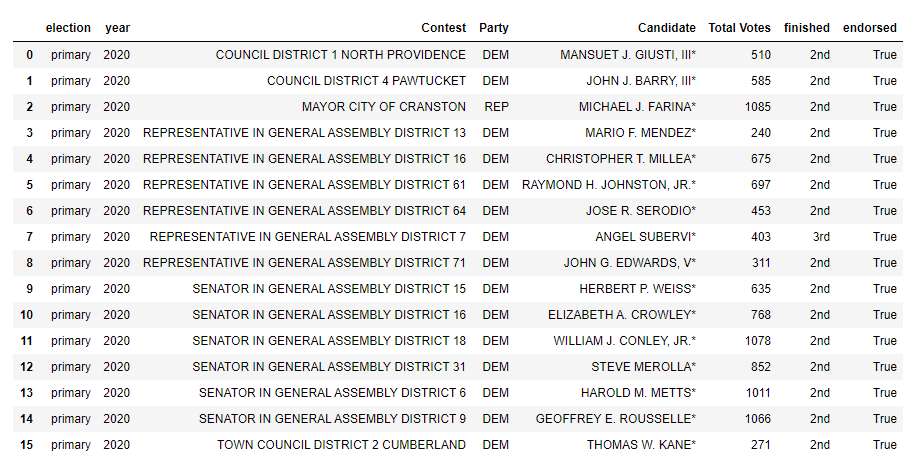
First starting with endorsed candidates that lost their primary. This table excludes multi-vote contests as there is no easy way to find out how many votes are allowed (with the data provided), and assumes only 1 of the candidates candidate was endorsed.

Elections Swapped by Mail-in
A large caution for this election was to be careful of paying too much attention to election day results. Concern that the large ammount of mail-in votes would swing many close contests in the upcoming days after the election. While this is a very real posability, the primary election only saw 1 race outcome affected by mail-in votes. Pawtucket Council District 4 (DEM) was the only contest to have the the main-in/emergency ballots change the leader in the race from election day results.

Closest Election Contests
However, that wasn't the only interesting race in Pawtucket. I narrowed down each single-vote contest down to the top 2 candidates by total votes. Allowing me to calculate the difference in votes among the top 2 candidates for every contests to find the closest race. Pawtucket Council District 5 (DEM) saw only a 2 vote margin between the winner and the runner-up.

Sources: RI BOE
Code: Github