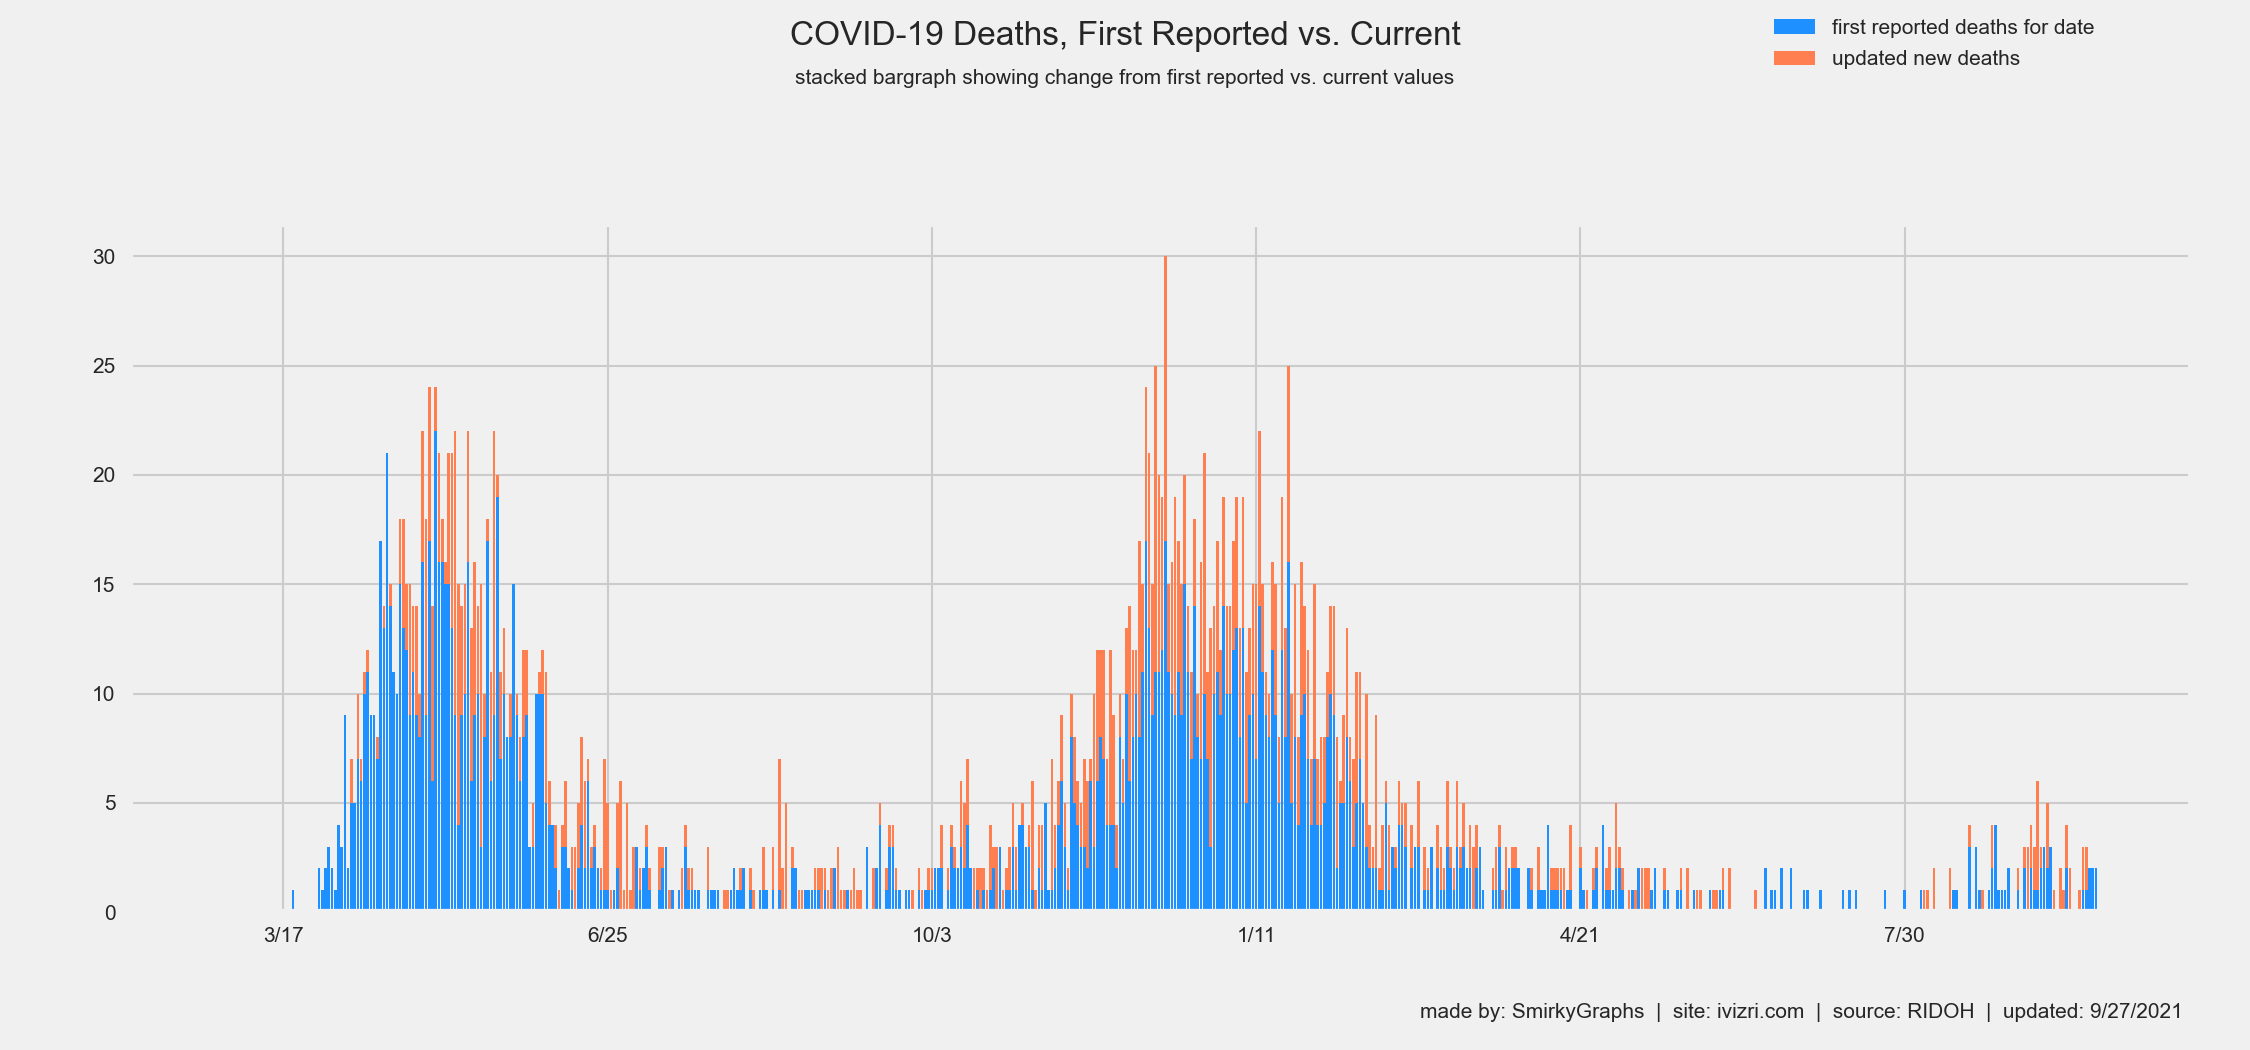
First Reported vs. Current (Bargraph)
This graph shows the additional deaths added to a date after the initial reported number by RIDOH in their daily updated trend data. The blue bar represents the initial number, typically reported the following day (Fri-Sat reported Monday and holidays at the end). The orange bar is any new deaths that have been added following that initial number. For example an initial number of 1 death for 6/24 was reported on 6/25 (blue bar). This number was increased to 3 the following day on 6/26, and further increased to 5 by 6/29. Therefore deaths on 6/24 would be shown as 1 blue and 4 orange.